Everything in one place
Dashboards over all your data, plus the apps that run your business, sharing the same people, companies and numbers.
Dashboards and charts
- Drag-and-drop dashboards with pages, filters, drill-down and click-to-filter
- Bar, line, area, combo, pie, gauges, KPI cards, maps, funnels, sankeys, waterfalls and more
- Calculated fields, what-if parameters and spreadsheet-style data sheets
- Explore: point at any data and get charts back
- Share, export charts and pages as PNG, PDF or CSV, and email report packs on a schedule
Your data, connected
- Upload spreadsheets and CSV files, versioned on every refresh
- Sync HubSpot, Pipedrive, Salesforce and QuickBooks on a schedule
- Read from Postgres, MySQL, SQL Server and Oracle databases
- Data rules so each person only sees their rows
CRM
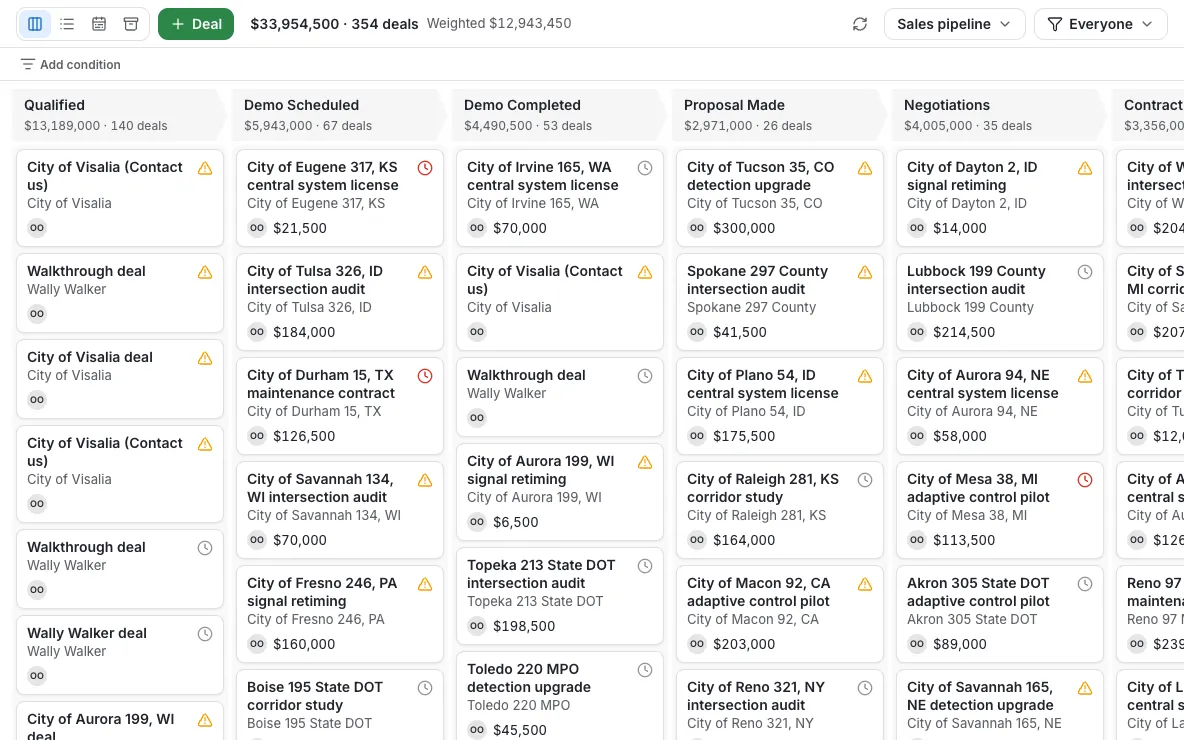
- People, organizations, leads and deals in a fast, spreadsheet-like list
- Pipelines with weighted values, rotting deals and lost reasons
- Activities and a calendar you can subscribe to
- Web forms, duplicate merging, custom fields, labels and import
Projects
- Lists, boards, timelines, calendars and workload
- Templates, rules, approvals, forms, portfolios and goals
- A won deal starts a project from your template
- Time tracking and project dashboards
Marketing
- Campaigns, workflows, funnels and conversations through HighLevel
- An account set up for your company and logins for your team
- Leads, forms and ad spend charted next to sales
Accounting
- Invoices, estimates, payments, bills, expenses and checks
- Bank feeds, rules, receipts and reconciliation
- Purchase orders, inventory, contracts, fixed assets, budgets and 1099s
- Month-end close checklist, flux analysis and approvals
- Several companies and currencies, intercompany entries and consolidated statements
- A 13-week cash forecast with what-if scenarios
- Bring your books over from QuickBooks Online
AI
- Describe a chart or dashboard and get it built from your data
- Ask questions about your books and get the report behind the answer
- Drafts for month-end explanations, report summaries and payment reminders, which you edit before use
- Unusual transactions flagged before you save them
- Admins turn AI on or off for each person and set monthly spending limits
Automation and API
- Automations: when something happens, email, notify, make a task or call a webhook
- A REST API with personal tokens, and signed webhooks for every change
Security and teams
- Access enforced in the database for every record, chart and report
- Roles per app, and people limited to some companies’ books
- Agency workspaces for each client
- An audit trail of changes